
“Cash is king” is an old saying. This is certainly true as many dairy enterprises are dealing with cash flow challenges brought about by suppressed milk prices and stubbornly high costs. Dairy Costings offer an insight and can highlight points for action on feed use.
Current situation
Whilst the average headline milk price currently stands at just under 37 pence per litre (ppl). For every farm paid above this, there is a farm paid below. There are inequalities in prices received which is a consequence of a free market, but inherently hard for those at the bottom end of the range.
The milk price currently sits in the shadows of a cost of production which is likely to average ~38ppl. As with the nature of the dairy enterprise, quite a large cost is incurred every month with little variation month to month. This is working overdrafts hard and unsustainably for some.
This will be especially true when tax has to be paid in January. For some, that tax bill will be equivalent to >50% of their income for the month. While many will have made provision, others will look to spread the cost out via the bank or HMRC.
In October 2023, the average Kingshay Dairy Costed herd reported a rolling 12 month Margin Over Purchased Feed (MOPF) of £2,555 per cow. This was from a milk price averaging 42.86ppl. With the average milk price currently sat at 36-37ppl the forecast rolling MOPF per cow will likely drop to £2,200 by the end of March, unless we see price rises in the New Year. Dairy Club estimates the average breakeven MOPF per cow is ~£2,278. To highlight, this covers depreciation on current assets, but does not leave any return for new investments. With the environmental pressures on the industry, there needs to be a residual for further investment.
Feed Costs
Feed cost per litre averaged 12.28ppl in October. This was a third of the milk check.

The chart shows the monthly purchased feed costs as a percentage of the milk cheque. We are currently at the highest point in nearly seven years.
The good news is, that feed costs will come down. But unless milk prices go up, it will likely still be over 30% of the milk price (blue dotted line).
The market for feed raw-materials is bearish at present, with not much on the horizon to lift markets. We are seeing funds short on positions, protein prices working their way back down to more typical levels, and exchange rates benefiting from a slightly weaker dollar.
This should see average feed costs per litre drop to ~10.75ppl over the next three months. Feed costs per tonne dropped from £338/t in September to £328/t in October, probably as new winter feed contracts kicked in. There should be a further drop shown on the November costings as they will fully reflect new contract pricing and lower spot prices.
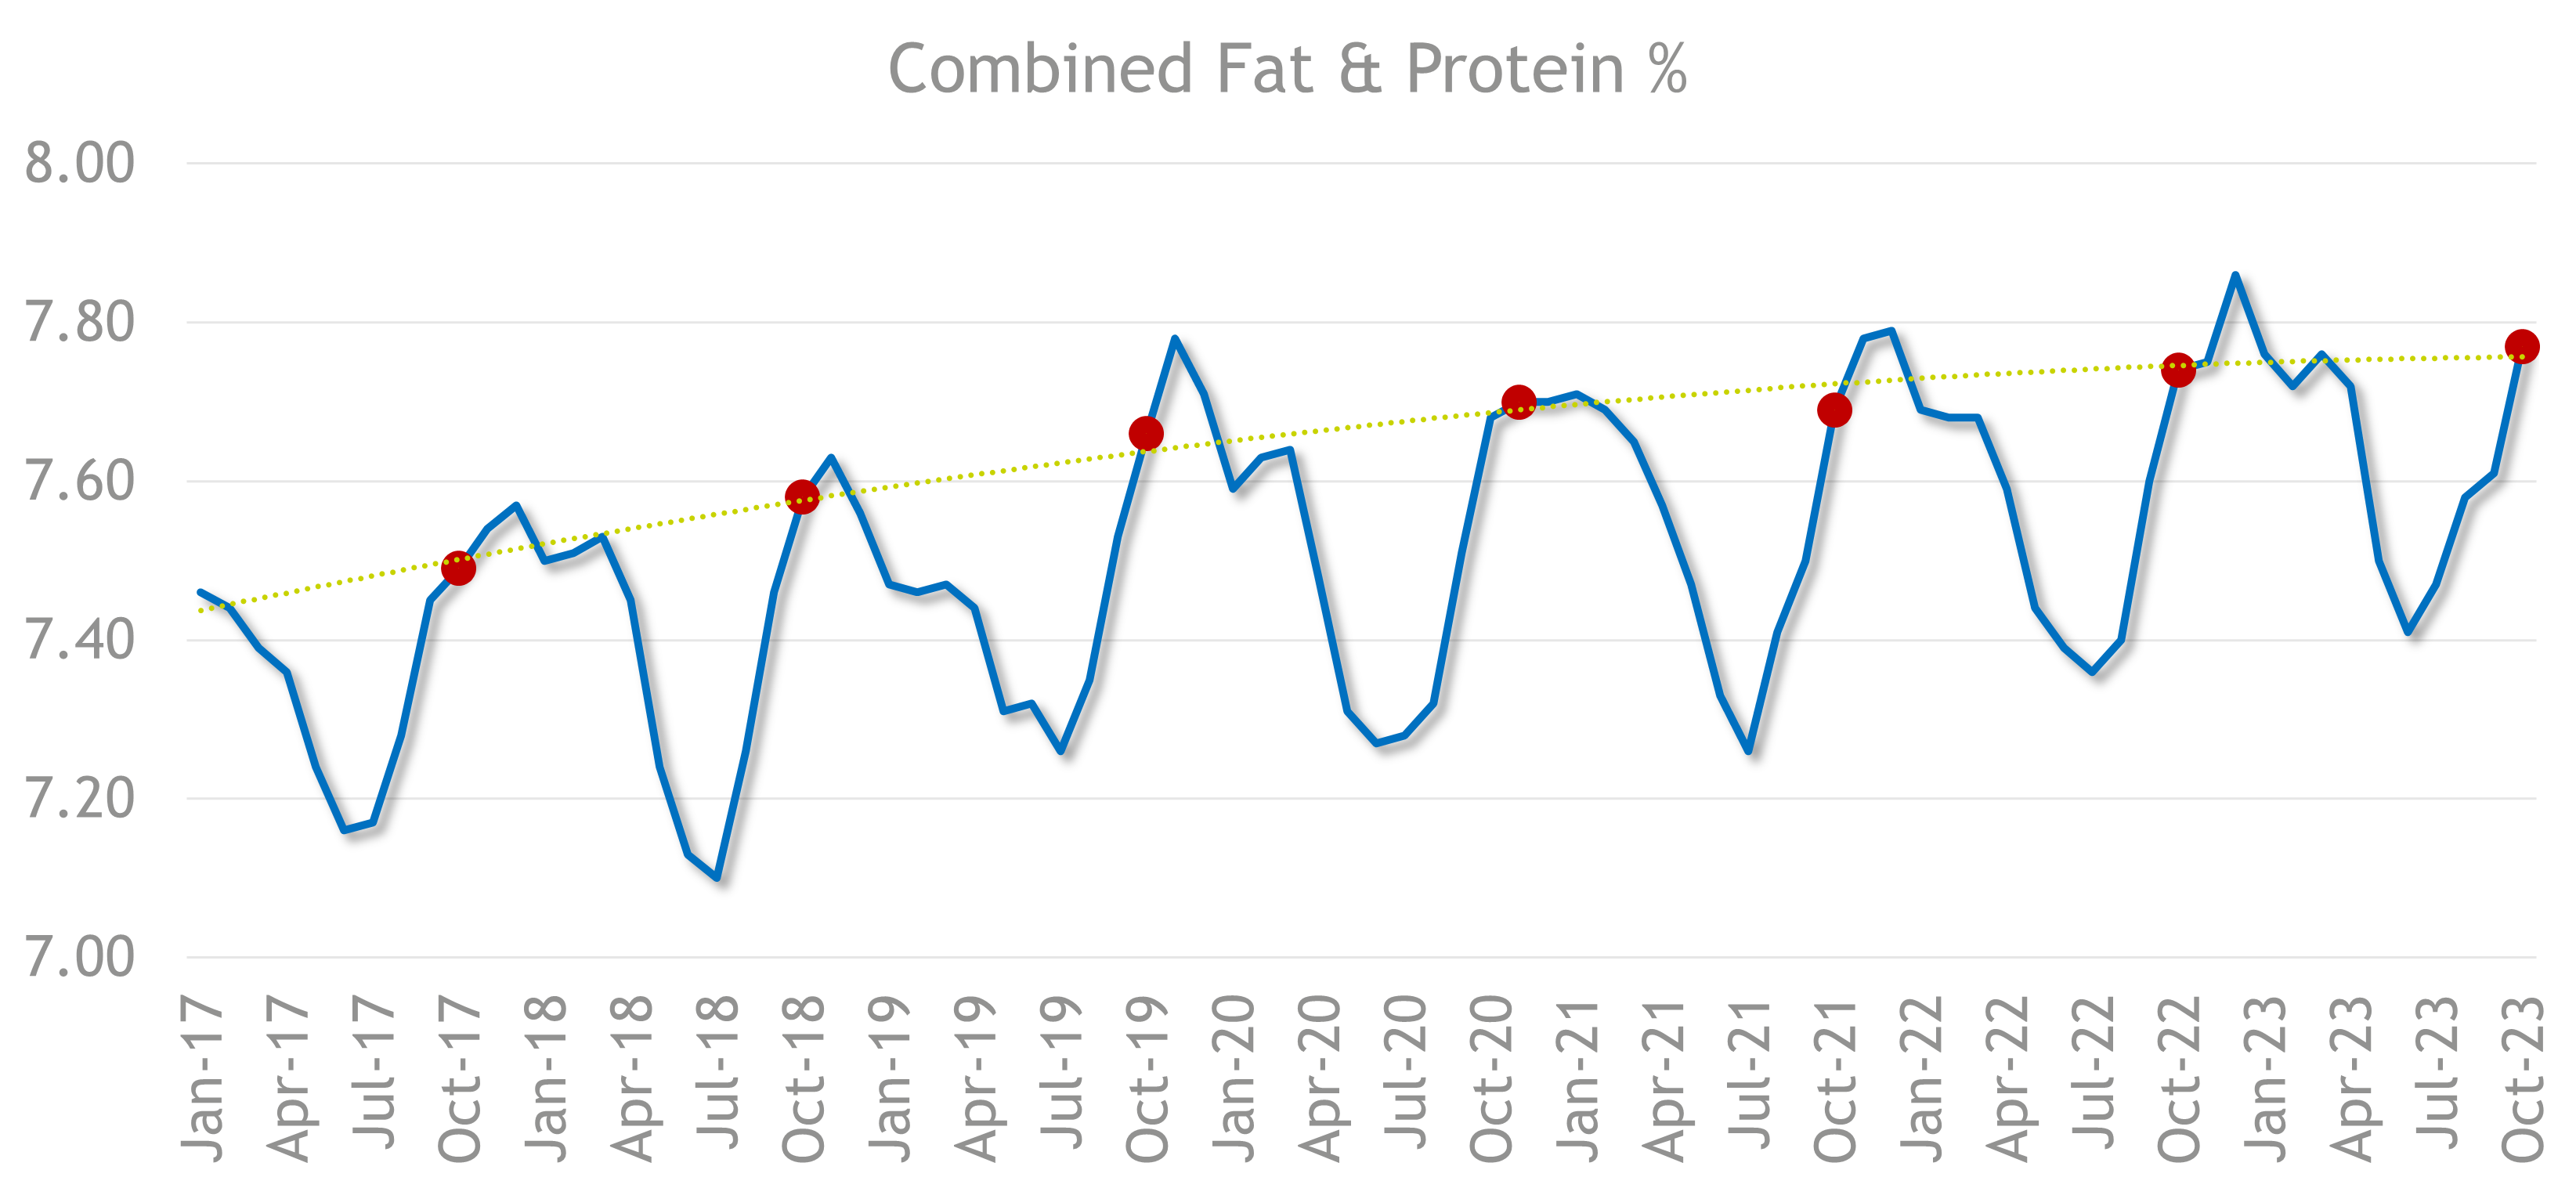
Milk Components & Feed Rate
Combined protein and fat percentages have been rising over time (see chart). Both fat and protein have risen.
This is helping add over a penny a litre to the milk price compared to a standard litre.
Even after correcting for the improvement in soilds production, feed rate per litre remains stubbornly around 0.34kg purchased feed per litre.
Challenging Feed Rate
Couple of key questions: Does actual feed use per month equal the expected feed use from your feed table? Does the feed table need adjusting?
Below is a herd that has a similar average yield to that on the Dairy Costings, averages 164 days in milk with 153 cows and similar feed rate.
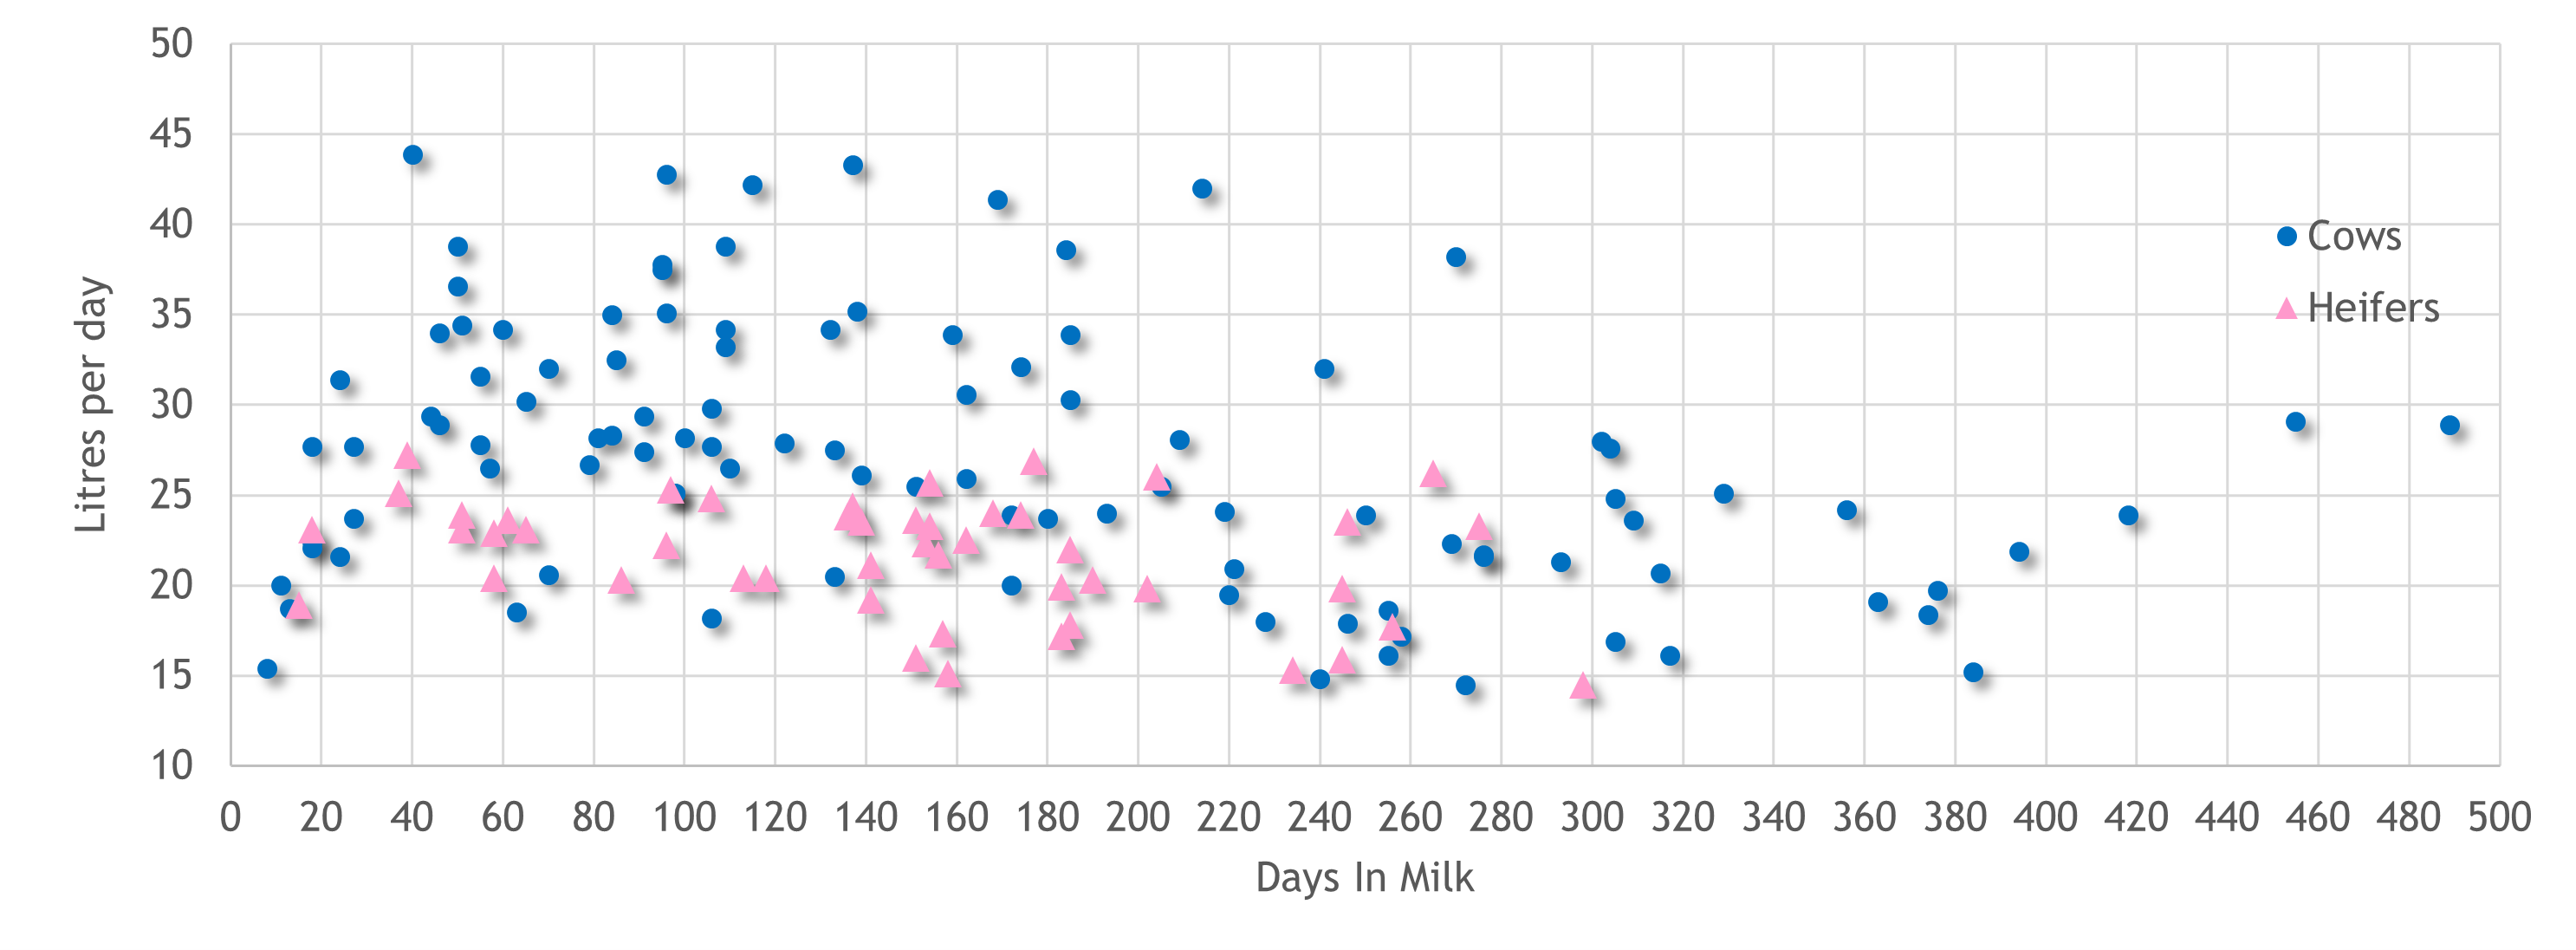
The herd is PMR fed with grass silage, maize silage and a blend. An 18% dairy cake in the parlour.
Considerations to help save feed costs for this farm:
- At what M+ should the PMR be set at?
- What feed rate are fresh calvers to be fed and how long for?
- Are the heifers coming into the herd ready for action?
- A few of the cows don’t seem to be firing. Should they stay?
- There are some long lactation cows. Should they be reviewed?
- Have the parlour feeders been calibrated lately?
- What is the cost of the diet and are all animals delivering enough margin?
Many milking parlour feed systems have feed tables built in to manage the feeding. It’s well worth cross checking that what is happening on the costing is what you expected from your feed table.
Below is a illustrative calculator which sets out a feed table and number of cows in each group from the herd above. On quick calculation the herd is actually using more than the theory calculated in the calculator. This highlights the need to check the parlour tables are working, test the parlour feeders and check blend use at the mixer wagon (A 5% loss is calculated in).
Below is an example of a simple manual Feed Table used for planning out step rate, lead feed or feed to yield strategies. Refining yours could save you feed and help with body condition.

Happy calibrating 🙂