Key facts:
| Herd Size | Target Yield | Fat% – Protein% |
| 210 | 6,000 litres – 590kgMS | 5.30% – 4.50% |
| Breed | Farm System | Calving Pattern |
| Crossbred | Grass, GS, MS + straights | Spring Calved – 13 weeks |
Issue: Low milk protein
Intro: This is a well run farm in NZ with a nice herd of crossbred cows (Not extreme crosses). Low milk protein has dogged the farm for years and cost a significant amount in lost revenue.
Tracker Analysis:
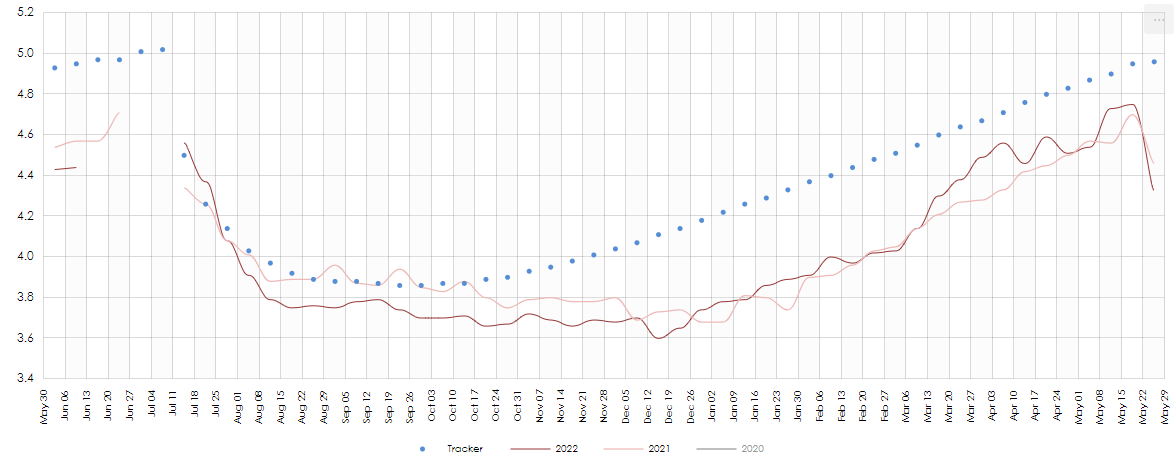
Bringing the farm’s data into Tracker quickly highlighted the issue the farm was facing. Below is the Tracker chart showing the bulk tank milk protein % (red line current season, pink line previous season). The blue dots are the Tracker prediction.

All is well in the first few weeks of calving but then the protein starts to drop away from Tracker and doesn’t get close to potential until the tail-end of the season.
This effect is much easier to see when we look at the milk protein in terms of kilogrammes. Percentages are great, but they are affected by the ‘liquidity’ of the milk which dilutes or distills out the numbers. Nutritionally we should be more focussed on kilogrammes of protein.

Now the picture is clearer. We can see that two years previous (yellow line) the protein yield had been significantly less.
The previous year (pink line) did improve in the second half of the season. This is useful to note and we will discuss this more in the discussion section below.
Looking at this year (red line), we see the start of the season is yielding much more protein then previously. This continues until the end of calving (13 weeks from start) then again drops significantly away from Tracker.
An important point here is that if we were not comparing against Tracker, then the protein yield looks good against historic production 🙂 Tracker calculates that the difference between the prediction and the actual is in excess of 8,150kg of protein. This was worth $76,000 (£38,000) at that year’s protein price. There is a lot of value left on the table by not filling this milk protein gap.
Discussion:
So, what can we derive from this analysis? The first, and probably most natural thing to investigate would be the protein nutrition of the herd. Did we supply enough protein, and if so was it good enough quality protein?
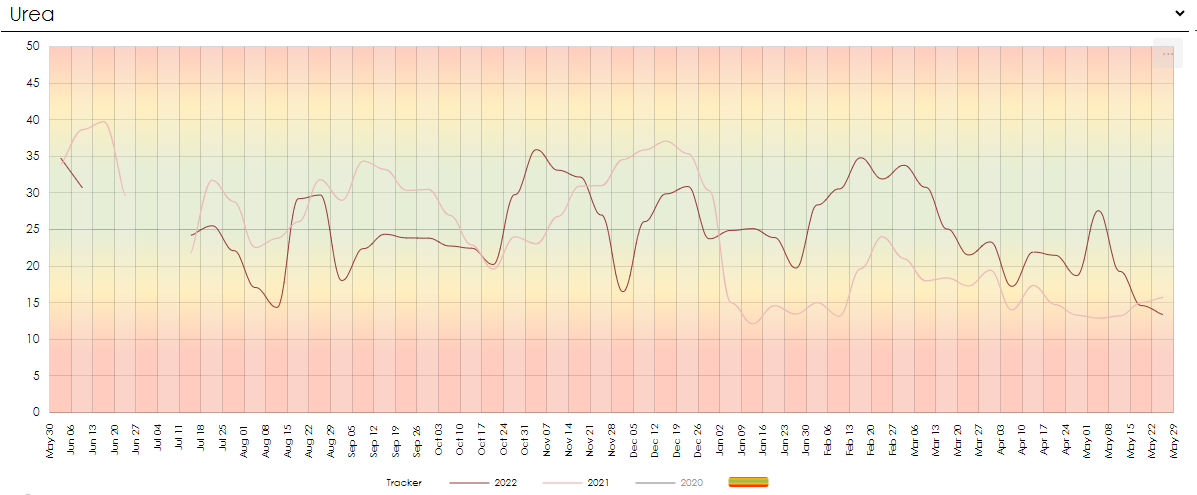
Generally grass based systems are literally awash with protein. Grass is typically well over 20% protein and therefore supplies far more protein than the cow needs. We can look to the milk urea reported in Tracker to give a piece of the puzzle on protein nutrition.

For most of the season the milk urea sits within the normal range.
There are some notable peaks and troughs, but these are fairly short lived.
There is nothing really here that would indicate a protein deficiency and ultimately milk urea is only a small piece of the protein puzzle.
It’s worth noting that the milk urea’s were quite low at the end of the previous year (pink line). Yet we know that the protein yield was better than previous.
Another piece of the protein puzzle is the quality of the protein fed. Crude protein as a measure is just what it says, crude. On urea fuelled grass, whether the nitrogen applied is convered into true protein depends on the quality of the soils, grass species and the weather. In this case it may well not have been made into true protein but was consumed as more basic nitrogen forms. If not captured by the rumen bugs, this N could well have just been lost in the urine.
For many of the farms analysed on Tracker, one of the key factors accounting for low protein has been a deficiency of sulphur on the farm. Sulphur is a component of some essential amino acids, but fundamentally is an essential facilitator for chlorophyll production in the grass. The higher the chlorophyll, the higher the grass sugars, the higher the energy supply to the cow, the higher the fermentable energy supply to grow microbial protein the higher the milk protein yield.
We also know that when the cow is deficient in sugars she can break apart certain glucose containing proteins. This in effect reduces the protein available to the udder for milk protein.
The data is highlighting an energy deficiency which will have an effect on fertility also.
Actions:
What Tracker is highlighting is that for this herd we need to carefully review, plan and monitor the nutrition of the herd focussing on:
- Dry matter intake – It is likely that dry matter intakes are lower than desired and this in turn is limiting energy intakes. Could we drive appetite?
- Protein supply – Is there enough quality protein supplied? Worth testing grasses for mineral assay, especially sulphur and sugars.
- Glucose supply – Is there enough starch and sugar in the diet ? This herd feeds maize silage but because feeding out is done outside next to trees the Minor Birds manage to pick out a good percentage of the grains…It’s not a minor offence, it’s a major one!
- Fermentable energy – Is there enough fermentable carbohydrates to fuel the rumen microbes to optimise microbial protein synthesis?
- Effective fibre – I’m adding this as we need the rumen pH to maintain it’s optimal range.
The above are the main starting points. Using Tracker we can plan the production for the next year which will give us the target dry matter intakes, energy and protein needs. Creating a feed and forage plan helps ensure we have planned for adequate nutrition to meet the cows needs.
Ultimately the cost of any actions needs to result in creating value above and beyond this cost. Tracker helps calculate the ROI (Return On Investment) so we keep both production and profit on track…
